Why Your High-Ticket Ad Attribution Is Lying to You (And How to Fix It)
Why Your High-Ticket Ad Attribution Is Lying to You (And How to Fix It)
High-ticket buyers — ₹50 lakh flats, ₹80 lakh cars, B2B contracts worth crores — do not impulse-buy. They read three blog posts, watch a brand video on YouTube, scroll your Instagram for a week, ask a friend, and only then type your brand into Google and convert. But if you are using Last Click Attribution, your marketing dashboard gives 100% of the credit to that final Google click — and zero to every touchpoint that actually convinced them.
This is not a minor reporting glitch. It is a decision-making disaster. Based on that flawed data, you cut YouTube, reduce your content budget, and double down on branded search — then wonder why your pipeline dries up six months later. At AdsVerse, we see this exact mistake repeated across real estate developers, luxury auto dealers, and high-ticket service businesses across India. Here is how to think about attribution properly.
1. Last Click Attribution — The Expensive Lie
Last Click Attribution is the default in most ad platforms and most analytics setups. Whoever gets the final click before conversion gets 100% of the credit. It is simple, easy to implement, and profoundly wrong for high-ticket products.
What a Real Buyer Journey Actually Looks Like
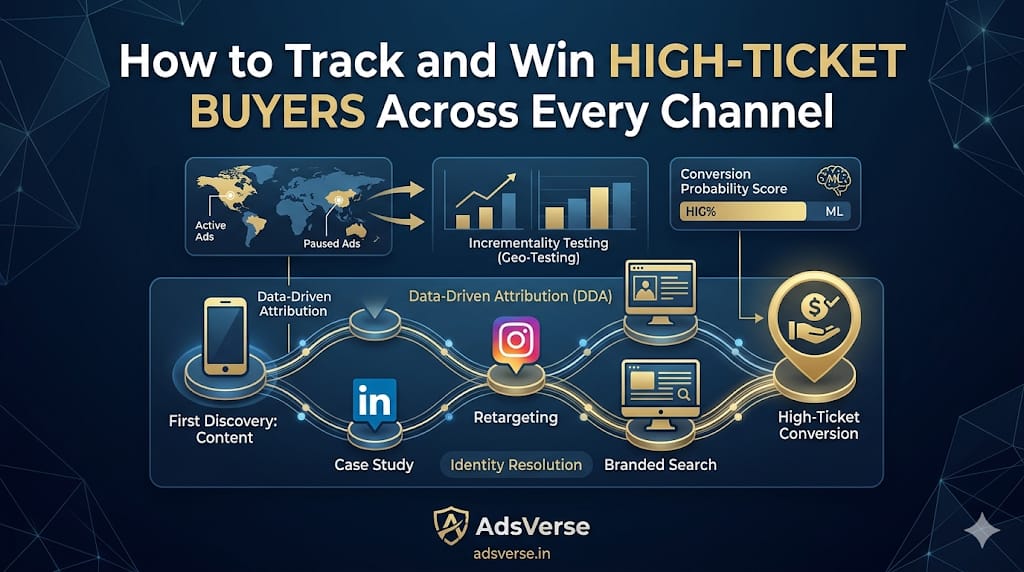
A prospect discovers your premium project through an organic blog post. Three days later, they watch your walkthrough video on YouTube. The following week, your retargeting ad catches them on Instagram. They visit your website directly, browse floor plans, and leave. Two weeks later, they type your brand name into Google, click a branded search ad, and fill out the enquiry form.
Last Click gives all credit to the branded search ad. The blog, YouTube, Instagram, and direct visit — all invisible. You look at the data, conclude branded search is your best channel, and kill everything else. Sound familiar?
Data-Driven Attribution: Credit Where Credit Is Due
Data-Driven Attribution (DDA) uses machine learning to distribute conversion credit proportionally across every touchpoint in the actual journey. It looks at the full path — which channels appeared together, in what order, how close to conversion — and assigns weighted credit accordingly.
2. The Device Gap — When One Buyer Looks Like Two People
Your HNW prospect discovers your project on their phone during a lunch break. They save your brochure link. Three days later, on their office laptop, they fill out the lead form. Standard analytics tools — relying on browser cookies — log these as two completely different users. Your retargeting fires at them like a cold lead. Your CRM creates a duplicate entry. Your sales team calls them as if they have never heard of you.
This is not just a reporting problem — it creates real friction in the buyer experience. For a premium brand, that friction is brand damage.
First-Party Identity Resolution
The fix is creating a First-Party CustomerID early in the journey. You give the prospect a small, compelling reason to identify themselves — a free investment guide download, a VIP floor plan PDF, access to an exclusive site walk video, or a webinar registration. Once they enter their email or phone number, that becomes their persistent ID across all devices and sessions.
- Create a lead magnet relevant to your buyer — detailed township master plan, luxury home buying checklist, or a "Market Report: Premium Residential Indore Q1 2026."
- Gate it behind a simple form — name, email, phone. This creates the CustomerID entry in your CRM.
- Pass that ID to your ad platforms via Customer Match (Google), Hashed Audiences (Meta), and LinkedIn Matched Audiences so all future touchpoints link to one profile.
- Map the complete journey from first discovery to site visit to booking — across phone, laptop, and tablet — against a single identity.
The result: a true 360° view of your buyer. You see which content built trust, at what stage they went warm, and when they are genuinely ready for your sales team to step in — instead of burning goodwill by calling too early.
3. Incrementality Testing — Are Your Ads Actually Doing Anything?
Premium brands often have strong organic reach, word-of-mouth referrals, and existing reputation. This creates a critical blind spot: how many of your "paid conversions" would have happened anyway, even if you had run zero ads? If you cannot answer that question, you are flying blind on what may be 30–40% of your total ad spend.
Geo-Testing: The Scientific Method for Marketing
Incrementality Testing — also called Geo-Testing — gives you that answer with statistical confidence. You select two comparable geographic regions. In one, you pause advertising entirely for a defined period. In the other, campaigns run normally. After the test window closes, you compare conversion rates between the two regions. The gap is your real incremental lift — the sales that only happened because of your ads.
| Region | Ad Status | Conversions (Test Period) | Reading |
|---|---|---|---|
| Control Region (e.g. Bhopal) | Ads paused | 12 enquiries | Baseline organic demand |
| Treatment Region (e.g. Indore) | Ads running | 31 enquiries | Paid + organic demand |
| Incremental Lift | — | 19 additional enquiries | Real value of your ad spend |
For a C-suite audience, this table is worth more than any dashboard screenshot. The CFO gets proof that marketing spend is generating genuinely new revenue — not claiming credit for sales that organic reputation would have delivered for free.
4. Predictive Attribution — Know What Your Buyer Will Do Next
The previous three sections are about measuring the past accurately. Predictive attribution is about using that accurate past data to act before the opportunity disappears. High-value leads have a narrow window — they are also talking to your competitors, evaluating three other projects, and being courted by their bank's wealth manager. Speed and precision matter more than any single ad creative.
Conversion Probability Scoring
By feeding complete multi-touch journey data into a machine learning model, you can assign a Conversion Probability Score to every lead in your pipeline. The model identifies patterns: return visits to the pricing page, floor plan PDF downloads, time spent on the "about the developer" section, repeat visits within a 7-day window, and previous engagement with WhatsApp messages all combine into a single confidence score.
Automated Triggers at the Right Moment
When a lead crosses a defined probability threshold, the system fires a personalised response automatically — without waiting for your sales team to manually catch it. Here is how we structure this for real estate and high-ticket service clients:
- Lead enters CRM via lead magnet form — CustomerID created, journey tracking begins across all devices.
- Behavioural signals accumulate — pages visited, content downloaded, email opens, WhatsApp response rate, time on pricing page.
- Score crosses threshold (e.g. 65+ / 100) — system tags lead as "Sales Ready" and triggers automated sequence.
- Personalised outreach fires — WhatsApp message with VIP site visit invite referencing the specific floor plan they viewed, sent within 2 hours of the trigger event.
- Sales team notified with full journey context — so the call is informed, not cold.
"Your buyers are not linear. Your marketing strategy should not be either."
— AdsVerse, on omnichannel attribution for high-ticket salesThis approach fundamentally changes your sales team's output — not because they are working harder, but because every call they make is to a lead that has already demonstrated serious intent through tracked behaviour. Conversion rates improve. Lead wastage drops. The pipeline becomes predictable.
5. Putting It Together — The Attribution Stack for Premium Brands
You do not need to implement all four frameworks simultaneously on day one. But you do need to start somewhere — and the starting point is always the same: stop letting last-click data make your budget decisions.
| Layer | Framework | What It Solves | Priority |
|---|---|---|---|
| 1. Measurement | Data-Driven Attribution (DDA) | Credit each channel fairly; surface Assisted Conversions | Start here |
| 2. Identity | First-Party Identity Resolution | Connect cross-device journeys to one buyer profile | Month 1–2 |
| 3. Proof | Incrementality / Geo Testing | Isolate real incremental revenue from organic baseline | Quarter 1 |
| 4. Prediction | ML Conversion Probability Scoring | Act on intent signals before competitors do | Quarter 2 |
Each layer builds on the previous one. DDA gives you accurate channel data. Identity resolution gives you complete buyer profiles. Incrementality testing validates that your spend is generating genuine new demand. Predictive scoring lets you act on that intelligence in real time.
Get an Attribution Audit for Your Campaign →
We will map your buyer journey, identify where last-click is costing you money, and show you the real ROAS of every channel — in one session.
Get Your Free Attribution Audit →